Figure 1: Egypt’s oil and gas fields
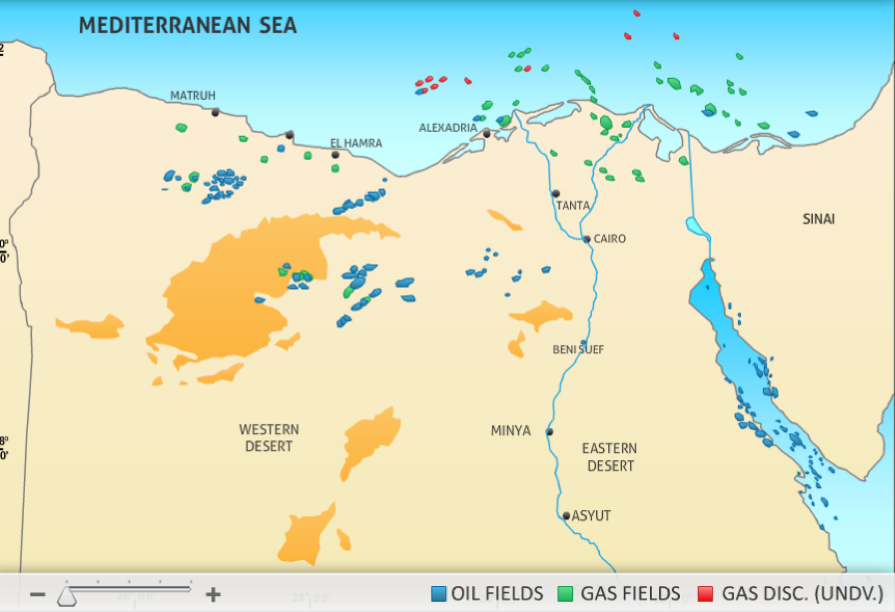
Source: Ministry of Petroleum
Egypt’s oil consumption overtook local production in 2010. In 2018, the country produced 670,000 barrels a day (b/d) of oil (including condensates and natural gas liquids), and consumed around 760,000 b/d, with the gap being plugged by imports. Output peaked in the mid-1990s and then entered decline as fields in the Gulf of Suez matured.
Figure 2: Egypts oil products vs consumption
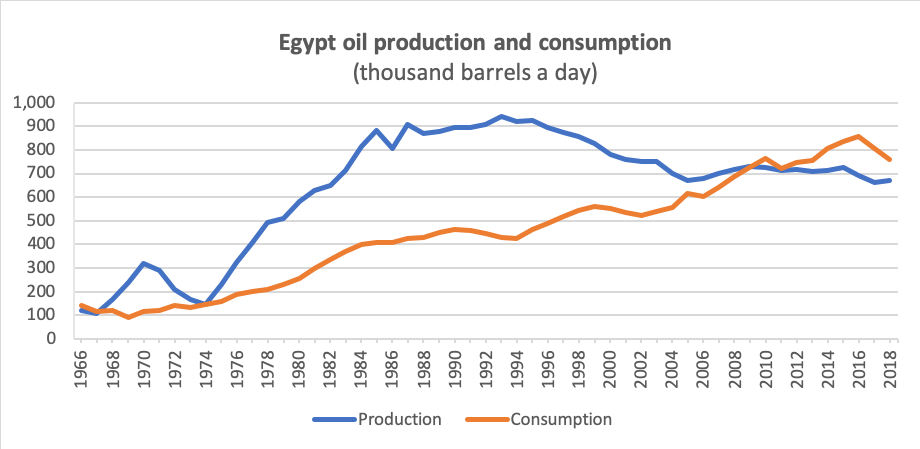
Source: BP Statistical Review of World Energy
Egypt’s gas market has experienced fluctuating fortunes over the past 20 years, swinging from significant surplus to deficit and then recovering strongly to an almost balanced market in 2018.
Egypt became a gas exporter in the mid-2000s, through a pipeline to Jordan and LNG facilities at Damietta and Idku, but low gas prices acted as a disincentive for IOCs to continue their exploration efforts, especially in more challenging areas. Export volumes soon tapered as the producing gas fields depleted faster than expected, meanwhile domestic consumption grew strongly. In the chaotic aftermath of the 2011 revolution, a gas shortage developed as IOCs stopped investing in their assets. The government was forced to halt LNG exports and divert the gas to the local market, which was suffering from crippling power outages.
Gas production has recovered sharply since 2016 thanks to the government’s efforts to clear its debts and improve the terms offered to IOCs, which has incentivised foreign energy companies to invest in Egypt’s upstream sector again and to fast-track field developments. Previously, the gas price was set at $2.73 a million BTUs.
Output from Zohr and the West Nile Delta in particular have helped rebalance the gas market, and while exports remain a fraction of what they should be, Egypt has at least been able to cease LNG imports in 2019.
In 2018, Egypt produced 58.6 billion cubic metres of gas, while demand was a little higher at 59.6 billion cubic metres.
The power sector accounts for more than 60% of Egypt’s gas consumption, followed by industry (23%), petrochemicals (9%) and households (5%).
FIgure 3: Egypt’s gas production vs consumption
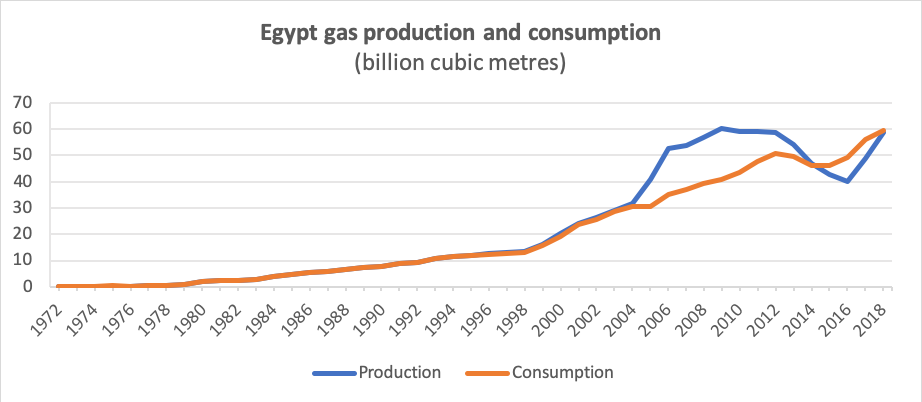
Source: BP Statistical Review of World Energy
Figure 4: Egypt’s LNG Imports
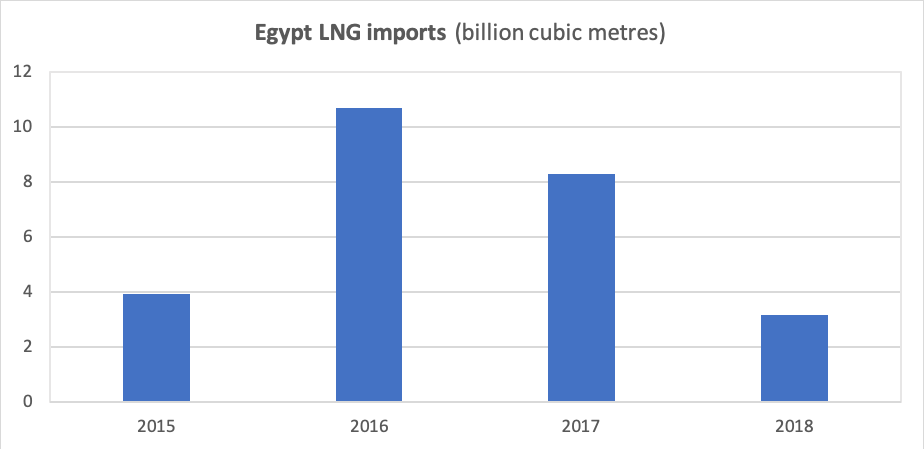
Source: BP Statistical Review of World Energy
Figure 5: Egypt’s LNG Exports
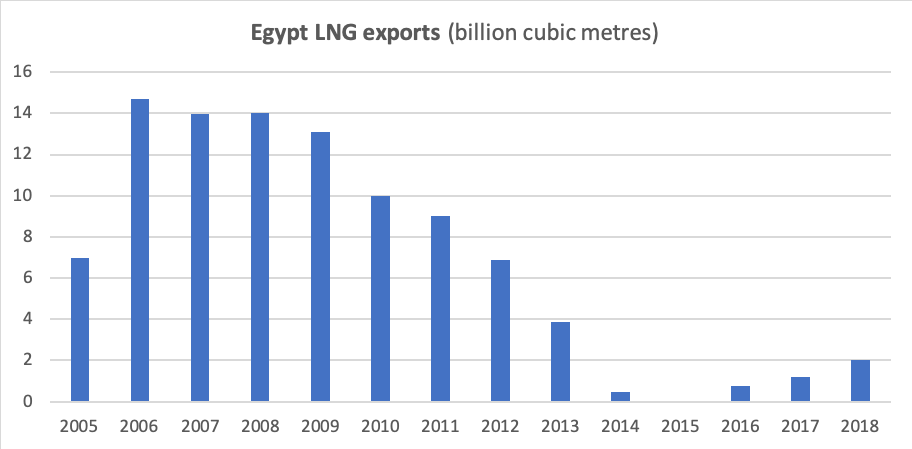
Source: BP Statistical Review of World Energy
Egypt has the most extensive gas pipeline network in Africa. As of the end of June 2018, the length of the national gas grid was more than 51,000 kilometres, with a capacity of some 240 million cubic metres a day. More than 8.8 million residential consumers have been connected to the grid since 1981.
Figure 6: Egypt’s National Gas Grid

Source: EGAS
Recent Comments